|
|
||||||
|
|

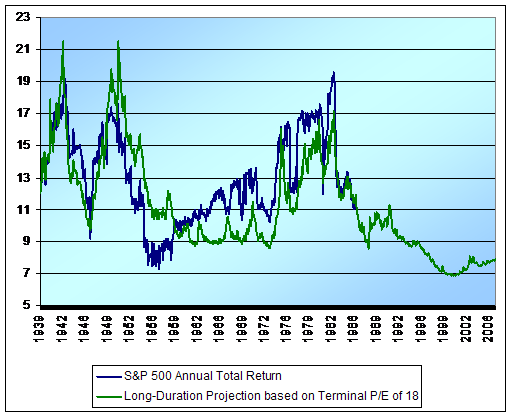
May 30, 2006 Apples to Elephants Among the frequent bullish arguments from analysts these days is the notion that stock P/E ratios are fair or even low - an assertion that is often made so straight-faced that you get the definite impression that the analysts actually believe it. And why not? It's well known that the historical average P/E ratio is about 15, so why not compare S&P 500 valuations to that benchmark? Unfortunately most analysts base their P/E measures on "forward operating earnings." "Forward" meaning next year or even two years out. "Operating earnings" meaning a measure not even defined under generally accepted accounting principles - GAAP - that typically excludes anything that reduces the predictability of earnings, and certainly excludes "extraordinary losses" even if those losses are taken routinely. The resulting, whitewashed earnings measure can easily be 25% or more above trailing net earnings (the prior-year's earnings as defined under generally accepted accounting principles). As Anne Casscells and Cliff Asness pointed out a couple of years ago, it's absurd to compare P/E's based on "forward operating earnings" with a historical average P/E based on "trailing net earnings." Asness calculated that the historical average P/E on forward operating earnings is closer to 12, and is probably lower since the average includes the late-90's bubble, but excludes valuations prior to the late 1970's (which is the earliest the data is available). Given that my own measure - price/peak earnings - has averaged less than 10 when S&P 500 earnings have been close to the top of their long-term 6% peak-to-peak growth channel, my guess is that the appropriate norm for forward operating P/E ratios is in roughly the same neighborhood. At the recent Berkshire Hathaway meeting, Charlie Munger derided this sort of disregard for valuations as an attempt to "compare apples to elephants in making accurate projections." [Referring to a well-known analyst who advocates stocks as great long-term investments regardless of valuations, Munger simply remarked "I think he's demented." Bill Hester, who attended the meeting, noted that Warren Buffett didn't focus much on the general lack of investment prospects in the markets, letting the company's cash position speak for itself. With regard to Berkshire's investment in Iscar, my impression is that the purchase was less an endorsement of international investment prospects in general, and more a very narrowly targeted diversification into a dominant, profitable company with a large market share in China . In other words, if China is a place to be, a risk-averse investor would prefer to consider well-established companies that have a solid position there, rather than chasing hot "emerging markets" stocks whose prospects are far less established]. What is the long-term? It's clear that on a short-term basis, the major stock indices remain oversold. It's reasonable to allow for a continued "fast, furious, prone-to-failure" rally to clear that condition, though we shouldn't rely on it. Given a mild seasonal support a couple of days prior to a holiday, the last two days of a month, and the first few days of a new month, some further strength here wouldn't be a surprise, and probably wouldn't do anything to shift our current defensiveness either. Those seasonal tendencies can often amplify the pressures on the prevailing Market Climate, but don't reverse them, on average. So as far as seasonals go, the conclusion isn't that we should be particularly optimistic about the next week or so, but rather that we might want to be particularly careful after the first week of June. That's the short-term picture, which doesn't change our position, but is worth mentioning because it encourages us to allow for both advances and declines (it's never good for an investor to be overly convinced that stocks will move in one direction only, and can't move substantially in another). As for the long-term picture, the current reality is that stocks remain priced to deliver fairly unsatisfactory long-term returns to buy-and-hold investors in the major indices. What is the long-term? Well, one way to think about that is to think about stocks as a claim on a long-term stream of future cash that will be delivered to investors. In the fixed-income market, a bond might deliver some of its interest payments in the early years, some in the later years, and finally a lump sum at maturity. The "duration" of a bond is basically the "average date" at which those payments come in (weighted by the proportion of the total bond value that's delivered at any given point). So a 10-year zero-coupon bond would deliver it's whole value at year 10, and so would have a duration of 10 years, while a 10-year, 6% coupon bond priced at par would have a duration closer to 8 years. What's interesting about duration is that it's also the horizon over which you can best predict your future wealth (assuming you reinvest your interest or dividends), regardless of where the stock or bond market goes over time. That's why buy-and-hold investors should generally try to match the duration of their investments to the duration of their obligations. In effect, duration is the most appropriate definition of "long-term" in the sense of making the final value of a buy-and-hold investment relatively independent of the path that the market takes over time. As it turns out, a good estimate of stock market duration is simply the price/dividend ratio of the S&P 500. That sounds like an implausibly magical fact, but there's a good amount of mathematics behind it (the February 23, 2004 weekly comment includes a detailed discussion on duration in the stock and bond markets). Notice what that means. Historically, the dividend yield on the S&P 500 has averaged close to 4%, for a price/dividend ratio of about 25. As a result, an investor with a 25-year horizon could feel comfortable investing 100% of his or her portfolio in stocks, and still be fairly confident that the terminal value of that investment would be independent of the path that stocks would go in the interim (of course, it's always better to invest a lump-sum when valuations are low). Currently, however, the price/dividend ratio of the S&P 500 is 52. As a result, for buy-and-hold investors with a horizon of anything less than 52 years, their investment security will be sensitively dependent on the path that the market takes between now and the date they need the proceeds. So whereas a 20-year period has historically been a long and generally reliable horizon over which to expect solid or at least predictable returns from stocks, the required horizon for buy-and-hold investors is now stretched into 3, 4 or even 5 decades. 52 years at 7.8% annually? Below, I've put together a somewhat unusual chart of historical returns on the S&P 500, in that the blue "total return" line isn't based on a fixed horizon. Instead, at every point in time, I calculated the price/dividend ratio on the S&P 500, and then measured the actual total return on the S&P 500 over that number of subsequent years. So for example, if the dividend yield was 5% (a price/dividend ratio - duration - of 20 years), I calculated the average annual total return on the S&P 500 over the following 20 year period. The blue line stops in the mid-1980's, because the durations for later points extend past the present date. You'll also notice a fairly close-fitting green line. That's the long-term estimated total return on the S&P 500 at each point, over the same expected duration, based on a 6% growth rate in earnings and a terminal price/earnings ratio of 18 (see the February 22, 2005 weekly comment for this formula and other details).
At present, the resulting figures imply that stocks are priced to deliver about 7.8% annually over the coming 52 years. That's not too surprising. Given a current P/E ratio of about 18, the assumption of a stable P/E ratio between now and then means that stock prices and earnings would grow at the same 6% annual rate. Kick in a 1.8% dividend yield, and there's your 7.8%. The point here is that we're not talking about stocks being priced to deliver 7.8% for a year or two. We're talking about the whole duration. That terminal P/E of 18 is actually very optimistic, because it was chosen to reasonably fit even the late 1990's bubble. On a longer historical basis, the resulting projections are too high. At the prevailing level of valuations, it hardly matters - even a terminal P/E of 20 would only increase the average projected total return to 8% annually. Still, when very optimistic assumptions are required to produce fairly unsatisfactory total return projections, it's a good bet that the situation won't last indefinitely. In practice, the path to nowhere will probably be fairly interesting. Rich valuations have a way of resolving themselves over a series of bull-bear cycles, with each successive bear achieving lower and more normal valuation troughs. As I've noted before, most bear markets (including the 1990 decline) have ended at a price/peak earnings multiple below 11 (and often below 9). A similar valuation, achieved say, 10 years from now, implies average annual total returns of just 3.28% on the S&P 500 between now and then. That's not a forecast, but it's far, far from an implausible or "doomsday" outcome. Meanwhile, despite the fairly tepid overall total return that's typical of these "secular" movements from rich to attractive valuations, the individual bull and bear swings have never failed to be exciting. Needless to say, I continue to view risk management as essential given prevailing conditions, regardless of short-term seasonal influences or oversold bounces. Market Climate As of last week, the Market Climate for stocks remained characterized by unfavorable valuations and unfavorable market action, holding the Strategic Growth Fund to a fully-hedged investment stance. In bonds, the Market Climate was characterized by relatively neutral valuations and unfavorable market action. The Strategic Total Return Fund presently carries a duration of about 2.5 years, mostly in Treasury inflation protected securities, and also holds a roughly 10% exposure in precious metals shares. --- The foregoing comments represent the general investment analysis and economic views of the Advisor, and are provided solely for the purpose of information, instruction and discourse. Prospectuses for the Hussman Strategic Growth Fund, the Hussman Strategic Total Return Fund, the Hussman Strategic International Fund, and the Hussman Strategic Dividend Value Fund, as well as Fund reports and other information, are available by clicking "The Funds" menu button from any page of this website. |
|||||||||||||||||||||||||
|
For more information about investing in the Hussman Funds, please call us at
1-800-HUSSMAN (1-800-487-7626) 513-326-3551 outside the United States Site and site contents © copyright Hussman Funds. Brief quotations including attribution and a direct link to this site (www.hussmanfunds.com) are authorized. All other rights reserved and actively enforced. Extensive or unattributed reproduction of text or research findings are violations of copyright law. Site design by 1WebsiteDesigners. |