|
|
||||||
|
|

February 4, 2013 A Reluctant Bear's Guide to the Universe In recent years, I've gained the reputation of a "perma-bear." The reality is that I'm quite a reluctant bear, in that I would greatly prefer market conditions and prospective returns to be different from what they are. There's no question that conditions and evidence will change, unless the stock market is to be bound for the next decade in what would ultimately be a low-single-digit horserace with near-zero interest rates. For my part, I think the likely shocks are larger, and the potential opportunities will be greater than investors seem to contemplate here. Investors who are eager to lock in whatever prospective return might be available at present valuations - or have operationalized their investment discipline and tested its outcomes across market cycles over history - can certainly ignore the evidence that drives my own concerns. Even then, I expect that the perspectives here would augment the performance of that discipline. But for investors who have tested no discipline at all, and have little data to support the enthusiasm that surrounds them, what follows is a summary of my concerns. Present market conditions now match 6 other instances in history: August 1929 (followed by the 85% market decline of the Great Depression), November 1972 (followed by a market plunge in excess of 50%), August 1987 (followed by a market crash in excess of 30%), March 2000 (followed by a market plunge in excess of 50%), May 2007 (followed by a market plunge in excess of 50%), and January 2011 (followed by a market decline limited to just under 20% as a result of central bank intervention). These conditions represent a syndrome of overvalued, overbought, overbullish, rising yield conditions that has emerged near the most significant market peaks – and preceded the most severe market declines – in history:
The blue bars in the chart below identify historical points since 1970 corresponding to these conditions.
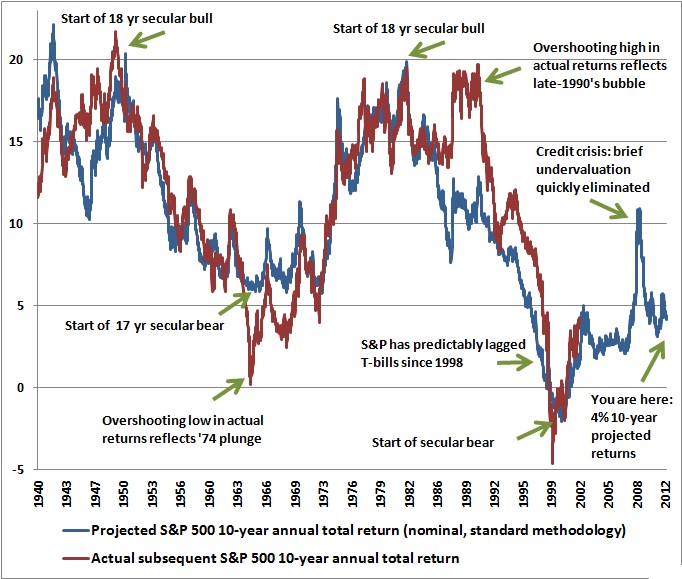
I can’t stress enough the importance of seeing the larger picture here – it would have been easy to miss the forest and get lost in the weeds and trees of daily and weekly market advances at each point identified in the chart above. Pursuing short-term returns in those environments would have been a mistake, because the initial losses typically came in the form of vertical “air pockets.” I’m keenly aware that the reflexive answer to these concerns is to disregard the messenger. After all, here's a guy who had compiled a great record by early-2009 (anticipating a market loss which incidentally erased every bit of return achieved by the S&P 500 in excess of Treasury bills, all the way back to June 1995), and yet, seemingly unable to invest his way out of a paper bag during the recent bull market advance. Fair enough – I don’t deny for a second that my insistence on making our discipline robust to extreme economic and financial uncertainties also shot us in the foot in the recent bull market upswing – but that unfortunately doesn't alter the objective evidence, or the severity of present conditions. For the record, our experience since 2009 largely reflects the miss that resulted after stress-testing our approach against Depression-era data, remaining defensive until I was satisfied that we could navigate a far wider range of future market and economic outcomes than investors presently seem to contemplate (see Notes on an Extraordinary Market Cycle for details on how that challenge was addressed). But again, none of that alters the fact that the period since March 2012 has been among the most negative 1% of historical instances on our measures. Our defensiveness during this period has been every bit reflective of what we would have advised in similar conditions throughout history (and in fact advised during similar conditions in 2000 and 2007). The S&P 500, after an entirely uncorrected advance and well over a year without a 10% retreat, is presently 6.8% above its March 2012 high. It’s an open question whether that gain will prove to be durable. It’s a good reminder that the average bear market loss represents a run-of-the-mill market retreat of about 32% and wipes out more than half of the preceding bull market advance. An average bear market within a “secular” bear market period (a period generally about 17-18 years, where valuations begin at rich levels and achieve progressively lower levels over the course of 3-4 separate bull-bear cycles) is about 39%, and wipes out about 80% of the preceding bull market advance. The following chart (from Too Little to Lock In) provides a view of the sort of valuations we typically see at the beginning of secular bull market advances, versus where we are at present.
It’s interesting that even among investors who embrace the evidence regarding present overvalued, overbought, overbullish, rising-yield conditions, we see a sudden focus on short-term considerations – commercial paper yields are still a few basis points below their 10-month average, economic conditions seem to have briefly shifted from threatening to merely tepid, and so forth. Moreover, investors unanimously point to the Fed, believing that it will be safe to hold stocks until the instant some signal occurs that inflation is picking up or the Fed is stepping back, and assuming that tens of millions of investors can simultaneously exit stocks at that point, into what would surely be a vacuum of demand. This is like standing by a window at a party, seeing an oncoming wrecking ball, and reasoning that the prevailing wind will slow the ball down long enough to eat another cupcake and still beat the crowd down the stairs the moment the glass breaks. Historically, widely embraced strategies like “don’t fight the Fed” and “don’t fight the tape” have performed poorly, on average, once overvalued, overbought, overbullish, rising-yield conditions have emerged. Notably, 10-year inflation expectations are already at 2.7%. As I noted a few weeks ago, based on long-term inflation expectations (measured by the spread between nominal Treasury yields and TIPS), further quantitative easing became inappropriate on precisely the day that it was announced. Further, the evidence from the most recent cycle is that the primary benefit of QE (both in the U.S. and among other central banks) is to help stocks to recover the loss that they experienced over the preceding 6-month period, and to temporarily enhance economic activity over a three-month period. The following chart presents data since 1929, to provide some idea of where Fed policy is at present. Interestingly, the only other time that the monetary base approached 17 cents per dollar of nominal GDP was in the early 1940’s, after which the consumer price index roughly doubled by 1952. Given the present size of the Fed’s balance sheet, the present options to unwind this position and eventually normalize short-term interest rates to even 2% are a) wait for nominal GDP to double, which would require about 14 years of real growth assuming a 2% inflation target; b) allow the price level to double; c) sell nearly $2 trillion of Treasury debt back into the market, adding to the amount of debt that must be absorbed by the public due to annual government deficits of about $1 trillion, or d) some combination of the above.
As a side note, the Federal Reserve presently has a balance sheet of about $3 trillion, on total capital of about $54.7 billion, meaning that the Fed is leveraged about 55-to-1. At an average maturity of over 10-years, the duration of the Fed’s portfolio is about 8 years, meaning that a 100 basis point move in interest rates impacts the value of the Fed’s holdings by about 8% (about $240 billion). Since July, interest rates have increased by about 60 basis points, which has undoubtedly wiped out the Fed’s capital, making it technically insolvent (fortunately for Ben Bernanke, the Fed doesn’t mark its capital to market). As a practical matter, the only effect is that the interest that the public pays on Treasury debt cannot actually be remitted by the Fed back to the Treasury as usual, but must instead be retained by the Fed in order to recapitalize itself due to losses on the bonds it holds. The losses therefore effectively represent an unlegislated fiscal expenditure. Moreover, assuming an average interest rate of about 2.5% on Fed holdings, each further increase of 30 basis points in interest rates would wipe out a full year of additional interest payments. Needless to say, nobody cares. These observations aren’t central to our current concerns, but it’s worth understanding how reckless Fed policy has already become. On the subject of Fed policy and market behavior, Bill Hester wrote an outstanding research piece this week - Fed Leaves Punchbowl, Takes Away Free Lunch (of International Diversification). It provides good perspective on the link between economic performance and international market returns, also highlights the growing importance of country selection in international investing. I've included a second link to that article at the end of the Fund Notes section. As Bill Gross of PIMCO observed last week “Credit is now funneled increasingly into market speculation as opposed to productive innovation. When does money run out of time? The countdown begins when investable assets pose too much risk for too little return.” I would suggest that this countdown is well underway. That doesn’t imply immediate inflation – indeed, my own expectation remains for inflation to remain reasonably subdued in a generally weak economy for the next couple of years, with significant price pressures emerging in the back-half of this decade. However, I think it is wildly incorrect to expect that the financial markets will indefinitely be locked into a very low volatility, very low return environment that forces investors to speculate for tidbits of return, relying indefinitely on the Fed to promise safety from an overvalued market and fragile global economy. I expect that the completion of the present cycle will produce far higher prospective returns, and far smaller prospective risks, than are presently available to investors. On the economic front, much of the enthusiasm about the economy here is actually driven by the behavior of stocks themselves. The actual data is far more mixed. New unemployment claims predictably spiked higher last week, as seasonal distortions came off (see Puppet Show). Non-farm payrolls for January increased by 157,000 jobs, which was below expectations, but positive enough – provided that one overlooks that the seasonal adjustment for January represented the addition of 2.12 million jobs, while the household survey showed an increase of only 17,000 after seasonal adjustments, and a loss of 1.45 million jobs before those adjustments. Suffice it to say that it’s dangerous to hang one’s hat and financial security on numbers that are smaller than the margin of error in their own seasonal adjustments. It’s important to again underscore that our concerns about stocks are independent of our economic concerns – the historical correlation between economic fluctuations and stock market fluctuations is actually quite weak, though the first 13 weeks of an economic recession are often wicked for stocks, and that window is of particular concern because recessions are invariably unrecognized at that point. The fact is that our estimates of prospective 5-10 year market returns assume nominal economic growth at a rate slightly in excess of 6% annually, and would otherwise be even lower than they are at present. Our main concern about recession derives from larger concerns about the serviceability of global debt burdens, and the strain that economic weakness would have on that serviceability. So again, we’ve assumed long-term economic growth in our valuation work. It’s just that the risk of economic downside is separately worth considering, because it would complicate already negative market prospects. All of that said, the present economic evidence is probably best characterized as mixed. We did see a negative GDP print for the fourth quarter (about 76% of the increase in personal income was actually driven by special dividends in advance of the fiscal cliff). In contrast, we saw a modest pop in the new orders index of the Chicago Purchasing Managers Report (most of the increase in the national PMI was on inventories), but this is far from the sort of sustained leap that we see in that component and the Philly Fed Index early in economic expansions. Our standard chart of regional and national economic surveys presents the picture fairly well – further deterioration in the broad indices overall last month, but a slight bump to the employment components. All of this is consistent with the brief “kick-the-can” improvement in economic activity that we’ve previously seen in response to Fed easing, but we really observe no evidence of some sudden economic renaissance here.
Does borrowing money and holding it as cash make for a “strong” balance sheet? Among the themes I’ve emphasized most over the years is the concept of equilibrium – the fact that every security, once issued, must be held by someone until that security is retired. That holds for stocks, bonds, and even cash. In aggregate, a “Great Rotation” out of bonds and into stocks is impossible. Every stock certificate and bond certificate must be owned by someone at every point in time. Nor is it possible to have more buyers than sellers for a given security. All that is possible is for the eagerness of the buyer to be greater than the eagerness of the seller, or vice versa. If someone is eager to sell bonds and buy stocks, and those levels of eagerness exceed the eagerness of other investors to buy the bonds and sell the stocks, then the prices of both securities will change. But after that transaction, there are just as many bonds outstanding, and just as many shares of stock outstanding than there were previously. There is no such thing as money going “into” or “out of” a secondary market. In contrast, a primary market transaction – like the issuance of new shares of stock or new debt certificates – represents an exchange of cash for a newly issued security. In a stock issuance, the new cash is presumably used to finance business activities that have some hope of paying a future stream of cash flows to the investor. In a bond issuance, the new cash is presumably used to do the same thing, or possibly to retire maturing debt. There’s another possibility of course. Suppose the economy goes through a wrenching liquidity crisis, where credit suddenly becomes unavailable, and the commercial paper markets (the typical source of liquidity for corporations) and the bank lending markets both freeze. In that case, an individual company, or companies in aggregate across the entire economy, might establish “precautionary” cash balances by running up debt and simply holding the proceeds in cash and cash equivalents. Wall Street might, in this case, celebrate all of that presumably idle cash on the balance sheet, in constant anticipation that it is about to be deployed. But having cash on the balance sheet would not be any reason to deploy cash, lacking specific projects that were expected to be profitable. Instead, the cash would sit on balance sheets as precautionary liquidity. In the banking system, with borrowers having few projects expected to be profitable, trillions of dollars of bank reserves would also simply sit idle on bank balance sheets. Welcome to our world. The following chart presents the amount of cash and equivalents (checking, savings, money market deposits, etc.) held on the balance sheets of U.S. nonfinancial corporations, according to the Z.1 Flow of Funds report of the Federal Reserve. On the scale at right is the total amount of debt owed by these same companies. Notice something: the amount of new debt obligations issued by U.S. nonfinancial corporations in recent years dramatically exceeds the amount of additional “cash on the balance sheets” they have accrued. To wit, the amount of cash on corporate balance sheets has grown by about $600 billion in recent years. The amount of debt has increased by about 5 times as much.
Oddly, Wall Street seems to celebrate “cash on the balance sheets” without accounting for the corresponding debt. I asked Bill Hester to verify these observations using individual company data on non-financial companies in the S&P 500. Sure enough, the amount of new debt issued by these companies has significantly outpaced the amount of new cash accrued in recent years. It’s also clear the largest companies in the S&P 500 are doing generally better than corporate America as a whole, accounting for most of the aggregate increase in balance sheet cash, but only about half of the increase in aggregate debt. In any event however, it’s hard to get too excited about corporate cash levels that – on the whole – have been more than matched by increases in corporate debt. On the prospects for zero 5-year market returns (even assuming 5-6% nominal GDP growth) We can have a bit more fun with the Z.1 flow of funds data. In particular, the data include figures on the net worth of U.S. nonfinancial corporations (at market value) as well as the total value of their equity securities. The ratio of equity value to net worth is presented below, along with the Shiller P/E ratio of the S&P 500 on the right scale.
It’s notable that, excluding the late-1990’s bubble, the post-war norm for the ratio of equity value to net worth is only about 0.6. Since 2000, the ratio has dropped from about 1.8 to slightly above 1.0 (a decline of about 55% in just over 12 years), and that drop has been associated with zero gain in the S&P 500. The math on that is pretty straightforward given that the overall growth of net worth has been about 5% annually since 2000: (1.05)*(1.0/1.8)^(1/12) – 1 = 0. You’ll note that secular bull markets, as began in 1950 and 1982, were associated with ratios closer to about 0.35. That would be a painful achievement to pull off, even a decade from now, as it would imply a loss in the S&P 500 over that 10-year period of roughly: (1.05)(0.35/1.0)^(1/10) – 1 = -5.5% annually (though somewhat less negative including a couple of percent in dividends). If the market is ever to enjoy a secular bull market period again, we have to accept the potential for valuations to achieve levels that have corresponded to the beginning of those secular advances, but that’s a very long-term issue. Even between here and there, market action would likely include perfectly reasonable cyclical bull market opportunities along the way. Our main concern is simply the completion of the present cycle. Just to establish that this ratio is, in fact, related to subsequent market returns, the chart below reverses the calculation slightly, showing the ratio of corporate net worth to the value of corporate equities on the left scale, and the total return on the S&P 500 over the subsequent 5-year period on the right scale. Note that there are two significant misses – one being the late-1990’s bubble (as valuations ramped to historic extremes instead of gradually reverting over time), and the other being the 5-year period from 2002-2007, which just happened to capture a nearly exact trough-to-peak bull market move in the S&P 500, and therefore exceeded what one would have expected on the basis of a more cyclical normalization of valuations. In any event, it should be evident that present valuations are consistent with near-zero total returns on the S&P 500 over the coming 5-year period. In contrast, a roughly 40% market decline (to a market value/equity ratio of 0.6 or an equity/market value ratio of about 1.7) would be required in order to expect more historically-normal prospective returns near 10% annually.
The S&P 500 is similarly overvalued on a wide range of fundamentals, with the notable exception of “forward operating earnings” where Wall Street analysts have baked in expectations for next-year’s profit margins that are about 70% above the historical norm (not to mention the indefinite maintenance of those margins). Unfortunately, the proper use of forward operating earnings implies a likely total annual return of less than 4% for the S&P 500 over the coming decade (see Valuing the S&P 500 Using Forward Operating Earnings for the arithmetic on this and the associated historical record). This matches our estimate based on a much broader range of fundamentals – indicating a likely total return for the S&P 500 averaging just under 4% annually over the coming decade, with an estimated total return of less than 1% annually over the coming 5-year period, and negative prospects at shorter horizons. This despite the fact that the total return of the S&P 500 remains behind Treasury bills for the past 13 years. We normally present our total return projections on a 10-year horizon because there is typically less “noise” from shorter-term variations in market valuations over that window. However, at present, it’s important to underscore the relationship between valuations and even shorter-horizon market returns, because investors seem to view even a 4% 10-year S&P 500 total return projection as “reasonable” compared to the 2% yield-to-maturity on 10-year Treasuries. On a 5-year horizon, our projections for S&P 500 total returns resolve to less than 1% annually, and on any shorter horizon, our return/risk estimates are modestly to severely negative.
I’ll end with a review of how we can expect market psychology to evolve over the completion of the present market cycle. It’s the same sequence that I suggested in April 2000: "This is my retirement money. I can't afford to be out of the market anymore!" "I don't care about the price, just Get Me In!!" "It's a healthy correction" "See, it's already coming back, better buy more before the new highs" "Alright, a retest. Add to the position - buy the dip" "What a great move! Am I a genius or what?" "Uh oh, another selloff. Well, we're probably close to a bottom" "New low? What's going on?!!" "Alright, it's too late to sell here, I'll get out on the next rally" "Hey!! It's coming back. Glad that's over!" "Another new low. But how much lower can it go?" "No, really, how much lower can it go?" "Good Grief! How much lower can it go?!?" "There's no way I'll ever make this back!" "This is my retirement money. I can't afford to be in the market anymore!" "I don't care about the price, just Get Me Out!!" The foregoing comments represent the general investment analysis and economic views of the Advisor, and are provided solely for the purpose of information, instruction and discourse. Only comments in the Fund Notes section relate specifically to the Hussman Funds and the investment positions of the Funds. Fund Notes As of last week, market conditions remained characterized by an overvalued, overbought, overbullish, rising-yields condition, the extremes of which have been observed only 6 other times in history: 1929, 1972, 1987, 2000, 2007, and 2011 (the last being reasonably forgettable, but still followed by a near-20% market decline). I doubt that the present instance will end any better, but that resolution may not be immediate, and I am quite aware how quickly each marginal new high in the market can erode both patience and prudence. It’s important to understand that our present defensiveness is intentional, and is the same defensiveness that our investment discipline would have indicated in the past under similar conditions. I should also note that much of the pullback experienced by Strategic Growth Fund in 2012 was driven by a roughly 7% lag in our stock holdings relative to the indices we use to hedge, despite the fact that our stock selection approach has significantly outperformed the S&P 500 since the Fund’s inception (see the review of Quarterly and Annual Performance on The Funds page for detailed performance data). The only other years where our stock selection approach even modestly lagged the S&P 500 were 2006 and 2007, just before the market imploded. Like then, investors embraced materials stocks, financials, and cyclicals, and our holdings simply aren’t carrying much weight in these sectors at present (nor do I believe we should depart from our stock-selection discipline in order to do so). If one wonders why we don’t offer a Fund of our unhedged stock-selections, given their record relative to the S&P 500 – wait about 18 months – it should be clear by then why we insist on the ability to hedge. Most of the remaining pullback in Strategic Growth last year was due to option decay very early in the year. Put simply, we have already implemented the responses that I insisted on due to stress-testing concerns and monetary interventions since 2009 (see Notes on an Extraordinary Market Cycle for details). What we observe at present, however, is a set of conditions that would never have warranted a constructive investment stance from the standpoint of our investment discipline. As I noted several months ago, “what I worry about most is that conservative investors will become impatient with maintaining a defensive position in a dangerous and elevated market - not because investment prospects have materially improved, but simply because short-lived runs of speculative relief seem too enticing to miss.” This is exactly what I see happening. Still, I’ve presented the evidence we are facing, and anyone inclined to cast away the messenger has more than enough information to distinguish between aspects of our own performance that were related to extraordinary stress-testing imperatives and aspects that were related to the ongoing pursuit of our investment discipline (hint – our defensiveness at present is related to the ongoing pursuit of our investment discipline). Investors who understand our avoidance of the 2000-2002 market plunge, our intervening shift to a constructive stance in early 2003, and our limited exposure to the 2007-2009 plunge should really have no difficulty understanding why we are defensive at present. It’s no fun being outside of the party, but nothing needs to be “fixed” here – this what I expect we will always do in equivalent situations. Indeed, it’s why we were able to comfortably walk away from two of the deepest market plunges in history, each which wiped out years and years of market performance in excess of Treasury bills. I doubt that investors who are late to exit this party – when everyone on Planet Earth appears to have the identical exit criteria – will be able to successfully walk away at all. I am not encouraging investors to abandon their own discipline, or to sell if your discipline is to buy-and-hold, but I would strongly encourage investors to allow for the possibility of the stock market losing something on the order of 40% of its value over the completion of the present market cycle. There’s nothing wrong with pursuing some other discipline provided that the outcomes of that approach have been tested over a century of data, and it performs well over each cycle (if not always over certain portions of it). It’s another matter altogether to accept risk in overvalued, overbought, overbullish, rising-yield conditions because you just can’t take being out-of-step with the crowd any longer. Strategic Growth Fund remains fully hedged, with about 1% of assets in a staggered-strike position that raises the strikes of its index put options somewhat closer to market levels, representing about 1% of assets looking out to April. Strategic International remains fully hedged. Strategic Dividend Value is hedged at about 50% of the value of its stock holdings (its most defensive stance). Strategic Total Return carries a duration of about 3.5 years, meaning that a 100 basis point move in interest rates would be expected to affect Fund value by about 3.5% on the basis of bond price fluctuations, about 10% of assets in precious metals shares, and about 5% of assets in utility shares. Notably, the ratio of the physical gold price to the price of gold stocks (gold/XAU) is at nearly the highest level in history. Previously, such extremes were followed by periods where gold stocks significantly outperformed the metal. Countering that tendency, rising Treasury yields tend to be a negative for precious metals, as is contained inflation, so our overall view on this sector is moderate, but still cautiously constructive. New from Bill Hester: Fed Leaves Punchbowl, Takes Away Free Lunch (of International Diversification) --- The foregoing comments represent the general investment analysis and economic views of the Advisor, and are provided solely for the purpose of information, instruction and discourse. Prospectuses for the Hussman Strategic Growth Fund, the Hussman Strategic Total Return Fund, the Hussman Strategic International Fund, and the Hussman Strategic Dividend Value Fund, as well as Fund reports and other information, are available by clicking "The Funds" menu button from any page of this website. |
|||||||||||||||||||||||||
|
For more information about investing in the Hussman Funds, please call us at
1-800-HUSSMAN (1-800-487-7626) 513-326-3551 outside the United States Site and site contents © copyright Hussman Funds. Brief quotations including attribution and a direct link to this site (www.hussmanfunds.com) are authorized. All other rights reserved and actively enforced. Extensive or unattributed reproduction of text or research findings are violations of copyright law. Site design by 1WebsiteDesigners. |