
|
|
||||||
|
|

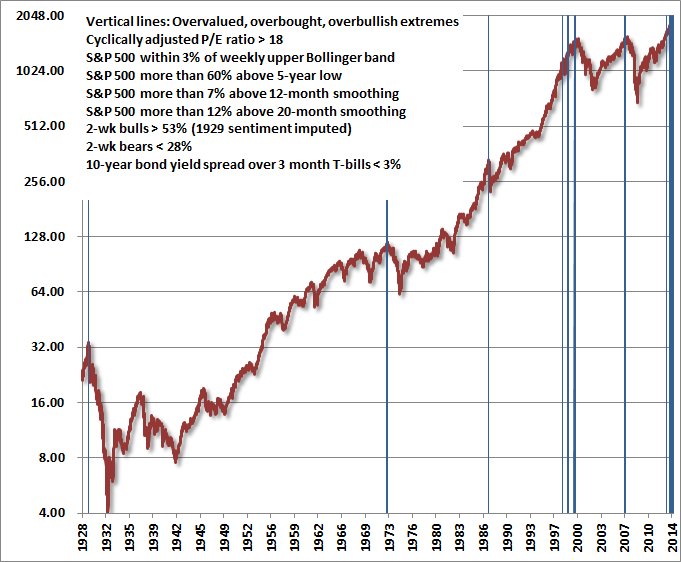
May 26, 2014 Exit Strategy The S&P 500 set a marginal new high on Friday, in the context of a broad rollover in momentum thus far this year that we view as likely – though of course not certain – to represent a broad cyclical peak of the sort that we observed in 2000 and 2007, as distinct from spike-peaks like 1987. Valuation measures remain extreme, with the market capitalization of nonfinancial stocks pushing 130% of GDP (relative to a pre-bubble norm of about 55%), the S&P 500 price/revenue ratio at 1.7, versus a pre-bubble norm of 0.8, and the Shiller P/E near 26 – which while lower than the 2000 extreme, exceeds every pre-bubble observation except for a few months approaching the 1929 peak. We presently estimate 10-year nominal total returns for the S&P 500 Index averaging just 2.3% annually, with zero or negative total returns on every horizon shorter than about 7 years. A side note about valuations and profit margins – my concern about record profit margins here is emphatically not centered on what profit margins may do over the next few quarters or years. The relationship between cyclical movements in earnings and stock prices is simply not very strong. Rather, as I noted in The Coming Retreat in Corporate Earnings, “my present concern is much more secular in nature. It can be expressed very simply: investors are taking current earnings at face value, as if they are representative of long-term flows, at a time when current earnings are more unrepresentative of those flows than at any time in history. The problem is not simply that earnings are likely to retreat deeply over the next few years. Rather, the problem is that investors have embedded the assumption of permanently elevated profit margins into stock prices, leaving the market about 80-100% above levels that would provide investors with historically adequate long-term returns.” In other words, we should not be concerned about extremely elevated profit margins because earnings are likely to weaken and stock prices might follow over the next couple of years (although that may very well occur). We should be concerned because investors are pricing stocks as a multiple of current earnings. They are implicitly using current earnings as if they are representative and proportional to the entire stream of future earnings going out over the next five decades or more. That’s what it means to use a valuation multiple. It means that you take some fundamental as a sufficient statistic for the stream of cash flows that the security will deliver into the hands of investors for decades to come. If you think you know what wage rates, competitive pressures, interest rates and tax policy will be 10, 20, 30, 40 and 50 years from now, and that the present situation is representative and permanent, good luck with that. Otherwise, investors should recognize that because of the variability of profit margins over the long-term, valuation measures that adjust for variations in profit margins have been dramatically more reliable than unadjusted measures over time (see Margins, Multiples, and the Iron Law of Valuation) Low volatility and suppressed short-term interest rates are a breeding ground for yield-seeking speculation. This reach for yield has now driven junk bond yields to about 5%, which is interesting given that yields are now near or below typical historical default rates. Meanwhile, the majority of new debt issuance today is taking the form of leveraged loans to already highly-indebted borrowers, with “covenant lite” features that provide little recourse in the event of default. This is the sort of behavior that should wake investors up like a triple Espresso. It doesn’t because they have been conditioned to focus on yield alone, without considering the minimal amount of capital loss that would wipe that yield out. This is not a new dynamic, and precisely because it is not a new dynamic, one can always find solace from the same Broadway kick-line of dancing clowns that reassured investors that credit was sound, subprime was contained, and stocks were still cheap in 2000 and 2007. Meanwhile, overbought measures also remain extreme, as investors have become conditioned to a perpetually diagonal advance like those that brought stocks to similarly overvalued, overbought, overbullish pinnacles throughout history (see The Journeys of Sisyphus). As I’ve often noted, there are countless ways to operationalize the concept of “overvalued, overbought, overbullish” depending on the severity of the condition one wishes to capture. Conditions that capture less severe market peaks also tend to include various false signals, while more restrictive conditions limit the set to the worst pre-crash peaks in history, but will tend to miss cyclical peaks that were less extreme). The following set of criteria falls into the more restrictive category, and limits the set to the 1929, 1972, 1987 peaks, three tech-bubble instances (the peak before the 1998 Asian crisis, a pre-correction peak in 1999, and the 2000 top), the 2007 peak, and of course, a solid band of warnings today. From our perspective, this time is different only in the extended period over which these and similar conditions have been sustained in recent quarters without consequence.
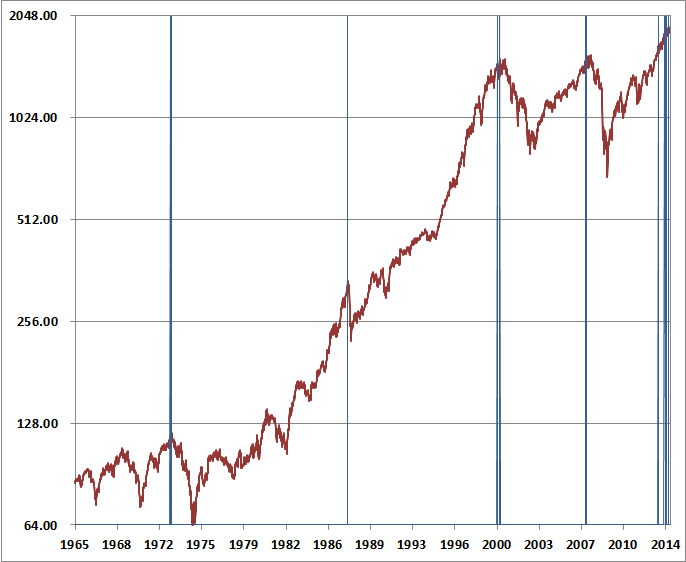
One of the things to note in the chart above is that the cutoff for the cyclically adjusted P/E is only 18, whereas the current multiple is 26. That’s another way of saying that we shouldn't be quibbling about the precision of the Shiller P/E, as the overvaluation condition above would be satisfied even if stocks were 30% lower. But the overbought, overbullish features are also important because we’d be perfectly happy having a constructive exposure to stocks in an overvalued market, provided favorable market internals and the absence of overbought, overbullish features. On interest rate factors, the yield curve tends not to be steep near market peaks (as steep yield curves tend to portend strong economic growth). If we further include a requirement of rising 10-year Treasury yields, the signals during the tech bubble narrow to 2000 alone, the other signals would remain, and the most recent band of signals would also narrow, within one in May 2013, and a collection of instances between November and March (additional chart). Of course, even one instance of the full syndrome has historically been enough to mark a cyclical peak, but at a fine resolution, those instances often don't precisely match up with the highs. That's another way of saying that any near term continuation we observe in this market is likely to appear quite insignificant in the context of what the market loses over the completion of the cycle. As I’ve frequently noted, the best return/risk profile for stocks is associated with a meaningful retreat in valuations (which as we saw in 2003 when we became constructive, certainly does not have to be to historical norms or below), coupled with an early improvement in market internals. The worst return/risk profile emerges when an overvalued, overbought, overbullish market begins to develop internal divergences. See Setting the Record Straight to understand recent decades from this perspective (including why the “miss” resulting from my decision to stress-test our methods against Depression-era conditions in 2009 should not mislead investors to ignore present concerns). On the basis of measures that actually are reliably related to actual subsequent market returns (and too many of Wall Street’s “valuation” measures aren’t at all), S&P 500 valuations are presently more than 100% above pre-bubble historical norms. In other words, stocks would be historically undervalued (in the sense of being priced for long-term returns in excess of about 10% annually) only after falling by half. That's not a forecast, but we also should not rule that out, and low interest rates alone are not sufficient to prevent that outcome in the event that investors seek higher risk premiums. Overly compressed risk premiums are now the largest ticking time bomb in the global financial environment. While it’s possible for risk premiums to become even more compressed (as they were in 2000 in large-cap tech stocks, though median stock valuations are already past 2000 levels), the Federal Reserve is already seeking an exit strategy from the policy of quantitative easing that has encouraged this speculative episode. We believe that investors should do the same – particularly those following a discipline that varies their exposure to risk over the course of the market cycle, or who have horizons shorter than a decade. When we compare the massive total capitalization of the U.S. stock market with the dwindling dollar value of average daily trading on U.S. exchanges in recent quarters, it strikes me that the repeated belief that a crowd can exit through a mouse hole is really one of the wonders of human psychology. Keep in mind also that stocks were priced for long-term returns in the mid-teens for decades prior to the mid-1950’s despite short-term interest rates that were close to zero. Absent a clear inflationary dynamic, the relationship between Treasury yields and prospective equity market returns is much weaker in the historical data than investors seem to believe. In my view, the fact that defensive investors are earning “next to nothing” in Treasury bills is not an objection that should make investors opt instead to risk a 40-60% portfolio loss. I know – that range sounds too extreme. For a reminder of how all of this works, see my April 2007 piece, Fair Value: 40% Off. The foregoing comments represent the general investment analysis and economic views of the Advisor, and are provided solely for the purpose of information, instruction and discourse. Only comments in the Fund Notes section relate specifically to the Hussman Funds and the investment positions of the Funds. Fund Notes The Hussman Funds remain strongly defensive in the equity markets, as our measures of present overvalued, overbought, overbullish extremes match only a handful of prior historical instances that include 1929, 1972, 1987, 2000, and 2007. There is no assurance that present conditions will be resolved as those instances were, but we view compressed risk premiums as the primary risk in the present market environment. At current valuations, we estimate prospective 10-year S&P 500 total returns averaging only about 2.3% annually, with zero or negative returns on horizons shorter than 7 years. Meanwhile, with 10-year Treasury yields at about 2.5% we remain slightly constructive, but continue to vary our exposure to long-term debt in response to change in prospective return/risk. The Strategic Total Return Fund is also moderately constructive toward precious metals shares here. --- The foregoing comments represent the general investment analysis and economic views of the Advisor, and are provided solely for the purpose of information, instruction and discourse. Prospectuses for the Hussman Strategic Growth Fund, the Hussman Strategic Total Return Fund, the Hussman Strategic International Fund, and the Hussman Strategic Dividend Value Fund, as well as Fund reports and other information, are available by clicking "The Funds" menu button from any page of this website. |
|||||||||||||||||||||||||
|
For more information about investing in the Hussman Funds, please call us at
1-800-HUSSMAN (1-800-487-7626) 513-326-3551 outside the United States Site and site contents © copyright Hussman Funds. Brief quotations including attribution and a direct link to this site (www.hussmanfunds.com) are authorized. All other rights reserved and actively enforced. Extensive or unattributed reproduction of text or research findings are violations of copyright law. Site design by 1WebsiteDesigners. |

