|
|
||||||
|
|

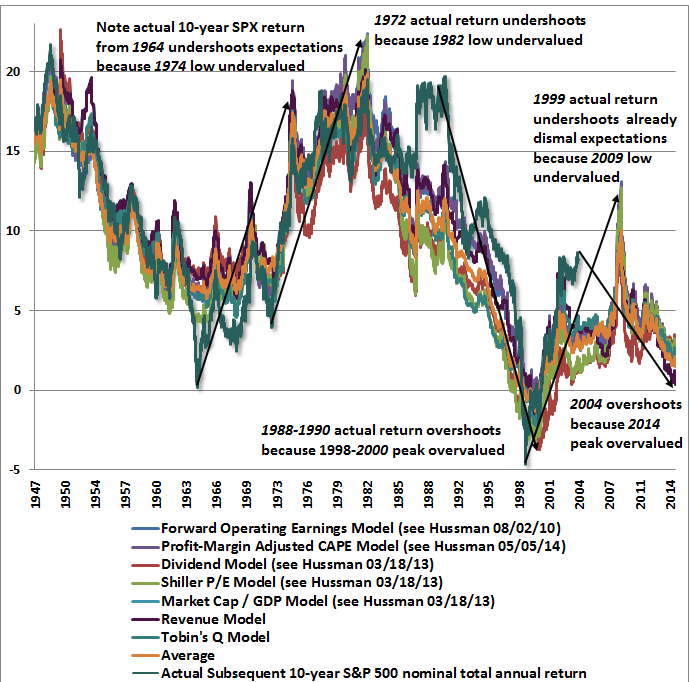
January 12, 2015 A Better Lesson than "This Time is Different" In June, we completed a very challenging transition in our methods of classifying market return/risk profiles. That transition started with my 2009 insistence on stress-testing our methods against Depression-era data, resulted in ensemble methods that were stronger across history than our pre-2009 methods, but failed to sufficiently capture certain bubble-tolerant features of those methods, and was completed when we adapted by imposing variants of those features as a set of overlays – largely relating to market internals, credit spreads, and other factors that I’ve often referred to as “trend uniformity.” You can see the effect of those overlays in the June 16, 2014 comment Formula for Market Extremes, with additional detail on this transition in Setting the Record Straight and Hard Won Lessons and The Bird in the Hand. If one wishes to share what we’ve learned from our experience, without dispensing of the benefits that we’ve demonstrated from this historically-informed, value-conscious, risk-managed discipline in prior cycles, the key lesson is this: The near-term outcome of speculative, overvalued markets is conditional on investor preferences toward risk-seeking or risk-aversion, and those preferences can be largely inferred from observable market internals and credit spreads. The difference between an overvalued market that becomes more overvalued, and an overvalued market that crashes, has little to do with the level of valuation and everything to do with investor risk preferences. Yet long-term investment outcomes remain chiefly defined by those valuations. I expect our experience in the future to be far more like our experience prior to 2009 than during the challenging transition that began with that 2009 stress-testing decision. I can’t offer assurances about the future, but I can offer assurance that we’ve completed this adaptation in a way that’s robust to every market cycle we’ve observed across history, including Depression-era data, post-war data, and the period since 2009. My confidence about the future is based on that robustness, irrespective of whether the market will collapse or continue to advance for years to come. I expect we’ll be able to navigate both. Learning the Right Lesson An unfortunate aspect of our awkward learning curve since 2009 is that it has emboldened many observers to use our experience as “proof” that market risk is always worth taking and that historically reliable measures of valuation have become ineffective, to be disregarded or replaced with some more benign alternative. The primary thrust of my weekly comments since June (when, in my view, we completed our awkward transition and put it behind us) has been to clarify the correct lesson to draw from our experience. Walk through this with me. I realize that this is repetitive for those who have been with me for a long time, but I promise you - it’s worth getting this lesson right. The coherent framework I’ve described – focusing on both the level of risk premiums (inferred from valuation) and the risk preferences of investors (inferred from observable market internals and credit spreads) is robust to market cycles, inflation, deflation, growth, recession, depression, easing, tightening, greed, exuberance, fear, panic, bubbles, and crashes across a century of history. With valuations extreme, credit spreads behaving badly and market internals still quite divergent, it’s absolutely essential for investors to understand that the current environment differs importantly from the bulk of the period since 2009. See, through most of this period, with key exceptions of mid-2010, mid-2011 and today, credit spreads have been well-behaved and market internals have been generally favorable. Overvalued, overbought, overbullish conditions that historically were followed by steep losses simply became more extended and severe, which was a persistent source of frustration for us. In hindsight, if one thing has been truly “different” about the half-cycle since 2009, it’s that the speculative yield-seeking provoked by quantitative easing has created much less overlap between periods of overvalued, overbought, overbullish syndromes and periods of deteriorating market internals and credit spreads. Historically, both features tended to emerge relatively close together. Not in recent years. But importantly, when they have – even since 2009 – the market has lost significant value during those periods on average. I’ll show you a bit of that in a minute. First, I want to reinforce the key lesson I’ve been emphasizing in recent months. “When risk premiums are historically compressed and showing early signs of normalizing even moderately, a great deal of downside damage is likely to follow. Some of it will be on virtually no news at all, because that normalization is baked in the cake, and is independent of interest rates. All that’s required is for investors to begin to remember that risky securities actually involve risk. In that environment, selling begets selling.” - Low and Expanding Risk Premiums are the Root of Abrupt Market Losses, August 11, 2014 “The effect of valuations on subsequent market returns is conditional. While depressed valuations are a good indication of strong prospective long-term returns, depressed valuations don’t prevent further – sometimes massive – losses in the near-term. A retreat in valuation becomes reliably favorable mainly when it is joined with an early improvement in market internals. All of history (not just the Depression-era and the 2008-2009 collapse) imposes demanding requirements; not least that internals aren’t collapsing and credit spreads aren’t shooting higher, as they are today. Conversely, overvalued, overbought, overbullish extremes are associated with total market returns below risk-free interest rates, on average, but that average features an unpleasant skew: most of the week-to-week returns are actually positive, but the average is harmed by large, abrupt losses. Such extremes become reliably dangerous when they are joined by deterioration in market internals.” - Air Pockets, Free-Falls and Crashes, October 13, 2014 “Our most important lessons in the half-cycle since 2009 are not that overvaluation and overextended syndromes can be safely ignored. Historically, we know that these conditions are associated with disappointing subsequent market returns, on average, across history. Rather, the most important lessons center on the criteria that distinguish when these concerns may be temporarily ignored by investors from points when they matter with a vengeance. In other words, our lessons center on criteria that partition a bucket of historical conditions that are negative on average into two parts: one subset that is fairly inoffensive, and another subset that is downright brutal. Central to those criteria are factors such as deterioration in the uniformity of market internals, widening credit spreads, and other measures of growing risk aversion. Once that shift occurs, market declines often bear little proportion to whatever news item investors might latch onto in order to explain the losses.” - On the Tendency of Large Market Losses to Occur in Succession, October 20, 2014 “Current equity valuations provide no margin of safety for long-term investors. One might as well be investing on a dare. However – and this is really where the experience of the past few years and our research-based adaptations come into play – there are some conditions that historically appear capable of supporting what might be called ‘rational speculation’ even in a severely overvalued market. Depending on the level of overvaluation, a safety net might be required in any event, and that would certainly be the case if those conditions were to re-emerge here. But following my 2009 insistence on stress-testing our methods against Depression-era data, and the terribly awkward transition that we experienced until we nailed down these distinctions in our present methods, the central lesson is worth repeating: “Neither our stress-testing against Depression-era data, nor the adaptations we’ve made in response extreme yield-seeking speculation, do anything to diminish our conviction that historically reliable valuation measures are of immense importance to investors. Rather, the lessons to be drawn have to do with the criteria that distinguish periods where valuations have little near-term impact from periods where they suddenly matter with a vengeance.” - The Line Between Rational Speculation and Market Collapse, December 29, 2014 “The best way to characterize our response is that it treats valuation extremes in a conditional way, which allows us to reconcile the full historical record without discarding inconvenient information. As I noted last week, what this framework requires, primarily, is the ability to withstand the cognitive dissonance of markets that are outrageously overvalued or undervalued, but persist until subtle deterioration or improvement in observable market internals and credit spreads indicates a shift in investor risk-preferences. When one faces two truths that are seemingly in opposition, the proper response is not to discard one of those truths, but to find a unifying principle that allows one to accept both truths at once. “We need not discard reliable indications that stocks are recklessly overvalued in order to recognize that there are certain conditions that allow a recklessly overvalued market to move higher still. Those conditions have been in place during much of the past few years, are not in place at present (see Iceberg at the Starboard Bow for a chart of cumulative S&P 500 returns in market conditions that match the present), but are subject to re-emerging, which for us could support a more constructive investment outlook even at valuations that are now well beyond twice the historical norm on reliable measures. There’s little chance that we’ll be considered bulls anytime soon, but there is a range of investment outlooks between hard-negative and constructive with a safety net. “In short, the near-term outcome of speculative, overvalued markets is conditional on investor preferences toward risk-seeking or risk-aversion, and those preferences can be largely inferred from observable market internals and credit spreads. The difference between an overvalued market that becomes more overvalued, and an overvalued market that crashes, has little to do with the level of valuation and everything to do with investor risk preferences. That, right there, is the primary lesson of our own challenging experience in recent years.” - Pills for Cognitive Dissonance in a Speculative Bubble, January 5, 2015 Does the recent decade prove that historical valuation measures no longer apply? Several charts below relate to valuations. However – rich valuations would have limited importance for near-term market outcomes provided that we could infer from market internals and credit spreads that investor risk preferences were still dominated by risk-seeking. Unlike much of the period since 2009, with the notable exceptions of mid-2010 and mid-2011 (both which were attended by material corrections), we can’t say that here, as market internals and credit spreads have deteriorated, and suggest a shift to increasing risk aversion. More on that in a bit. I generally discuss valuations on the basis of the measures we’ve found best correlated (about 90%) with actual subsequent 7-10 year S&P 500 total returns over a century of history. On the most reliable measures, stocks are about 120-140% above historical valuation norms – yes, more than double the level that one would associate with historically adequate expected returns. On the basis of a broader group of reliable measures, we estimate prospective 10-year S&P 500 nominal total returns of only about 1.4% annually over the coming decade, with negative returns over horizons of 8 years or less. See Ockham’s Razor and the Market Cycle for the derivation and arithmetic of these estimates. Below are some alternate measures which suggest the same broad conclusion. The first chart comes from Doug Short, which shows current valuations now beyond the 1929 peak, exceeded only by the 2000 bubble. Below Doug’s chart, I’ve aligned a chart of the actual subsequent 10-year total returns of the S&P 500 on an inverted scale (so lower points on the chart represent higher subsequent returns). Note that points of “secular” undervaluation such as 1922, 1932, 1949, 1974 and 1982 typically occurred about 50% below historical mean valuations, and were associated with subsequent 10-year nominal total returns approaching 20% annually. By contrast, valuations similar to 1929, 1965 and 2000 were followed by weak or negative total returns over the following decade. That’s the range where we find ourselves today. Of course, we also won’t be surprised if the S&P 500 ends up posting weak or negative total returns in the 2007-2017 decade, which would require nothing but a run-of-the-mill bear market over the next couple of years.
One might object (and some have) that the S&P 500 has performed better over the past decade than one would have estimated by such methods in 2004. To these observers, that “error” is evidence that these valuation metrics can be taken without concern. The problem, as I demonstrated in Do the Lessons of History No Longer Apply? is this: “What’s notable is not only the strong correlation between estimated returns and actual subsequent returns, but also that the errors are informative. For example, notice that the actual 10-year S&P 500 total return in the decade following 1964 was significantly lower than one would have projected at the time. The reason is that the 1974 market plunge was so brutal, with the market losing half of its value, and bringing the new estimate of prospective returns to significantly above-average levels. Looking at this chart at the 1974 low, one might have been concerned that the methods were too optimistic since the prior 10-year return was so much worse than what one would have projected a decade earlier. Those concerns would have been unfounded, as the 1974 low represented one of the best secular buying opportunities in history, especially for the broad market.
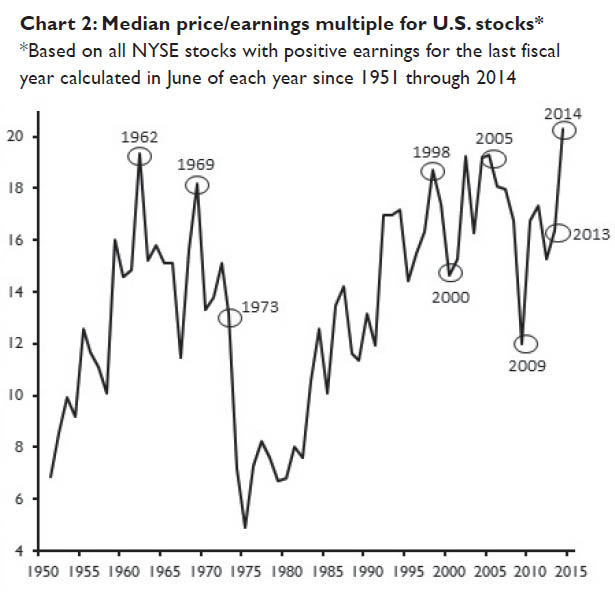
“Conversely, the actual 10-year S&P 500 total return in the decade following 1988-1990 was significantly higher than one would have projected at the time. The reason is that the 2000 market bubble was so extreme, bringing the new estimate of 10-year S&P 500 returns to negative levels. Looking at this chart at the 2000 peak, Wall Street would have undoubtedly argued that these measures of valuation had become unreliable or useless. That argument would have proved tragically wrong, as the S&P 500 promptly lost half of its value (three-quarters of its value for the Nasdaq), and posted negative total returns for well over a decade. “Given the full weight of the evidence, it should be clear that one can’t just say ‘well, look, the S&P 500 has done better than these models would have projected a decade ago,’ and use that as a compelling argument that this time is different and historical regularities no longer hold. Quite the opposite – the overshoot in S&P 500 total returns since 2004 – relative to the prospective returns one would have estimated at the time – is highly informative that stocks are strenuously overvalued at present. That conclusion has strong statistical support. In fact, when we examine the historical evidence, we find that there’s a -68% correlation between the error in the projected return over the past decade and the actual subsequent total return of the S&P 500 in the following decade. That is, the more actual 10-year S&P 500 returns exceeded the return that was projected, the worse the S&P 500 generally did over the next 10 years. Notably, the ‘Fed Model’ has a correlation of less than 48% with actual subsequent 10-year returns. It’s sad when a valuation measure that is so popular is outperformed even by the errors of better measures.” Another instructive chart on the valuation side comes from a surprising source – Jim Paulsen of Wells Capital (h/t ZeroHedge). The median price/earnings ratio for U.S. stocks is now at the most extreme level on record. Investors may not realize it, but in our view, even the 4% average annual total return of the S&P 500 since March 2000 is an ephemeral gift that has been achieved only by pushing valuations back to extreme levels today.
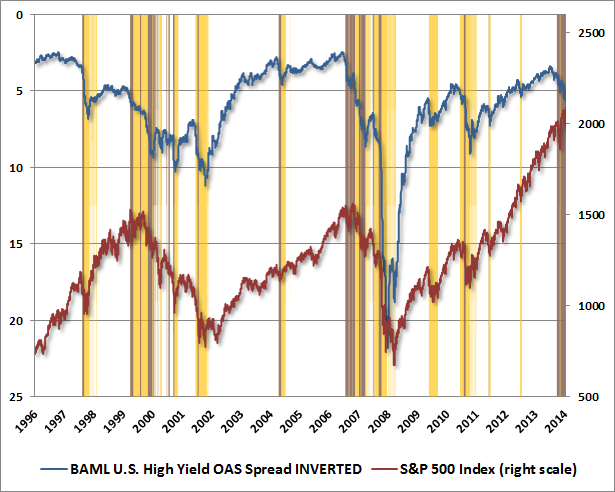
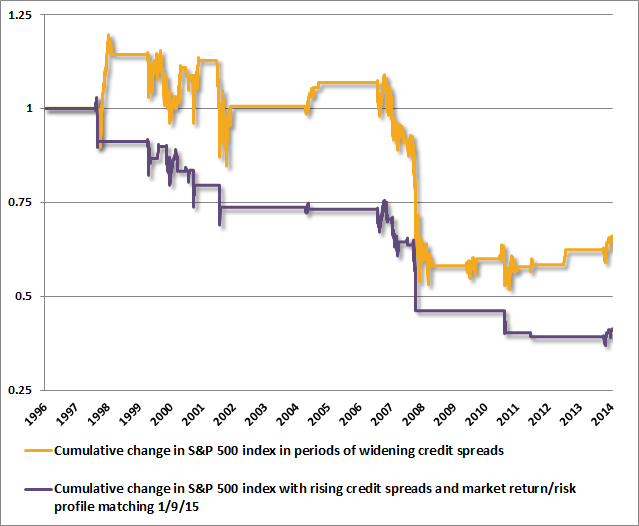
In short, the reason that actual market returns over the past decade have overshot the returns that one would have anticipated based on the valuations observed in 2004 is quite simply that valuations at the end of this particular 10-year interval have reached nearly the highest level in history. Although valuations did normalize temporarily in 2009, the most reliable metrics currently place valuations between 90-140% above historical norms. Of course, for those not inclined to test their methods against evidence, there are certainly many popular and unreliable metrics to suggest that valuations are just fine. A better lesson than “this time is different” Q: Why have valuations overshot historical norms so dramatically? Q: Doesn’t QE, zero interest rate policy and (insert your excuse for ignoring history here) mean that this time is different? Q: Given the adaptations you’ve made in recent years, what was your error in being so defensive in the face of persistent overvalued, overbought, overbullish conditions? Q: Are internals and credit spreads still supportive for the equity market? Q: Why are market internals and credit spreads deteriorating? Q: Is the market likely to crash? Low and expanding risk premiums are the root of abrupt market losses On the subject of credit spreads, a bit of additional color may be helpful in clarifying the important distinction between risk-seeking and risk-averse market environments. With apologies for the busy appearance, the blue line on the chart below shows the Bank of America Merrill Lynch high yield option-adjusted spread (essentially a measure of corporate credit spreads on low-quality debt) on an inverted scale, so a falling blue line means credit spreads are widening – that is, investors are demanding more compensation for default risk. The red line is the S&P 500 Index. The yellow shaded areas show points where credit spreads might be defined as “rising.” For simplicity, I’ve shaded all points where credit spreads had advanced 90 basis points from their 6-month low, and were greater than their 150-day moving average. Observe that the steepest losses we’ve observed in the S&P 500 in recent decades have been concentrated during those periods of objectively widening credit spreads. I’ll say this again: low and expanding risk premiums are the root of abrupt market losses. The purple shading identifies only a subset of those points that also match the market return/risk profile that we currently observe (basically identifying recently overvalued, overbought, overbullish conditions that were then joined by deteriorating market internals or widening credit spreads).
Notably, those purple shaded bars only cover about 9% of the period from 1996 to the present, yet this handful of periods captures a cumulative subsequent market loss of fully 60%. The chart below shows the cumulative change in the S&P 500 index, confined to sessions where the prior close was in the yellow and purple ranges, respectively. Now, there are certainly other periods where the market return/risk profile was weak enough to make market risk generally unattractive, but by and large, the purple lines capture the points where a hard-negative outlook would be appropriate. Note the abrupt air pockets and free-falls. That’s the situation we observe at present.
Don’t believe me – just watch For those who trust and value our work, I hope that I’ve clarified exactly when and how we’ve adapted to the challenges of recent years, in a way that helps to understand both the successes we’ve enjoyed over time, and the difficulties that we’ve experienced in the recent half-cycle. Again, we can’t assure that future cycles will mirror the lessons of a century of historical evidence. What we do know for certain is that the framework that we’ve outlined is robust to every market cycle we’ve observed across a century of history, including the tech bubble, the housing bubble, and the most recent half-cycle since 2009. Our outlook will shift as market conditions change. Though future cycles may be different, historical market conditions have been consistent with our current hard-negative outlook less than 10% of the time, a flat and rather neutral outlook about 30% of the time, a constructive and partially hedged outlook about 10% of the time, and an aggressive, leveraged outlook more than half of the time. Given that I advocated a leveraged investment stance through much of the early 1990’s, and shifted to a constructive outlook following the 2000-2002 bear market (and again after the 2008 collapse, though admittedly impeded by my insistence on stress-testing), none of that that should be a complete surprise. I have little doubt that we’ll find good opportunities to be constructive or aggressive over the completion of the present cycle and in future ones. As Bruno Mars would say, don’t believe me – just watch. New Fund Notes and Commentary are posted this week. The foregoing comments represent the general investment analysis and economic views of the Advisor, and are provided solely for the purpose of information, instruction and discourse. Please see periodic remarks on the Fund Notes and Commentary page for discussion relating specifically to the Hussman Funds and the investment positions of the Funds. --- The foregoing comments represent the general investment analysis and economic views of the Advisor, and are provided solely for the purpose of information, instruction and discourse. Prospectuses for the Hussman Strategic Growth Fund, the Hussman Strategic Total Return Fund, the Hussman Strategic International Fund, and the Hussman Strategic Dividend Value Fund, as well as Fund reports and other information, are available by clicking "The Funds" menu button from any page of this website. |
|||||||||||||||||||||||||
|
For more information about investing in the Hussman Funds, please call us at
1-800-HUSSMAN (1-800-487-7626) 513-326-3551 outside the United States Site and site contents © copyright Hussman Funds. Brief quotations including attribution and a direct link to this site (www.hussmanfunds.com) are authorized. All other rights reserved and actively enforced. Extensive or unattributed reproduction of text or research findings are violations of copyright law. Site design by 1WebsiteDesigners. |