|
|
||||||
|
|

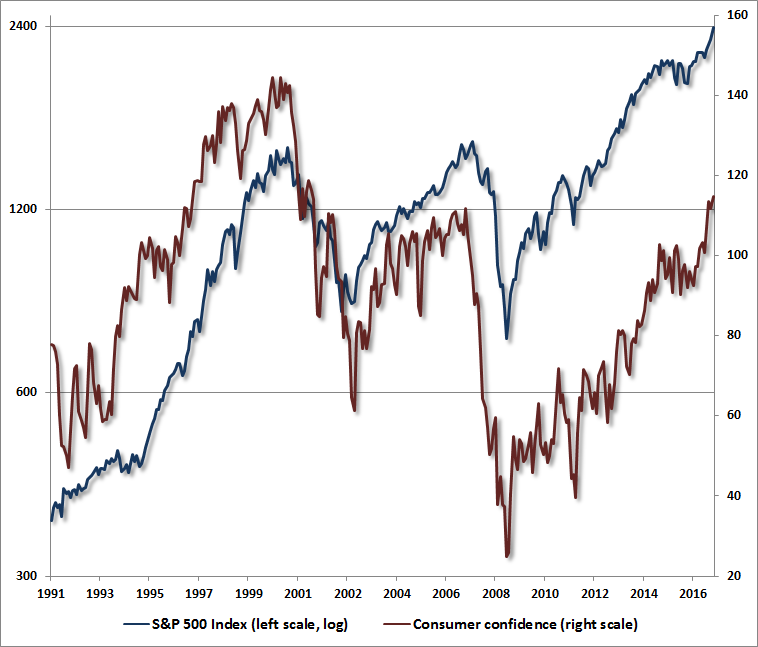
March 13, 2017 Blue Skies Blue skies smilin’ at me The late Sir John Templeton once said, “Bull markets are born on pessimism, grow on skepticism, mature on optimism, and die on euphoria.” A week ago, bullish sentiment among investment advisors soared to the highest level in 30 years (Investor’s Intelligence), joined last week by a 16-year high in consumer confidence. When one recognizes that the prior peak in bullish sentiment corresponds to the 1987 market extreme, and the prior peak in consumer confidence corresponds to the 2000 bubble, Sir Templeton’s words take on both relevance and urgency. As I detailed last week, the most historically reliable valuation metrics have advanced within a few percent of their 2000 peaks, while the median valuation of S&P 500 components is now easily at the highest level on record (for charts and other analysis, see The Most Broadly Overvalued Moment in History). Extremes in consumer confidence, coupled with extremes in investor sentiment, valuation, and price extension, have regularly marked important market peaks and troughs. In most market cycles across history, those extremes have usually been joined or closely followed by early deterioration (at peaks) or improvement (at troughs) in the internal uniformity of market action. When various components of market internals begin to diverge from the “obvious” trend, it indicates that investor risk-preferences are shifting from risk-seeking to risk-averse, or vice versa. The most negative market outcomes generally emerge when overextended valuations are joined by early deterioration in market action. The most favorable market outcomes generally emerge when material retreats in valuations are joined by early improvement in market action. I’m fully aware of how eagerly many investors dismiss our current concerns, as well as our record prior to 2009, because of the inadvertent challenges that followed my 2009 insistence, after a market collapse we fully anticipated, on stress-testing our methods against Depression-era data. The central lesson of the recent advancing half cycle is this. Unlike other market cycles across history, even the most extreme overvalued, overbought, overbullish syndromes were not enough to discourage speculation in the presence of zero interest rates. Instead, zero interest rate policy required one to wait for market internals to deteriorate explicitly before adopting a hard-negative outlook, a restriction that we imposed on our methods in mid-2014 (see Portfolio Strategy and the Iron Laws for a more detailed narrative). As I noted last week, absent that challenging period, I doubt that anyone would find my present market outlook, in the face of historically obscene valuations, as either controversial or inconsistent with the identical concerns I expressed in 2000 and 2007. Presently, we observe the broadest market valuation extreme in history, with the steepest median valuations on record, and the most reliable capitalization-weighted measures within a few percent of their 2000 peaks. In addition to extreme valuations, bullish sentiment, and consumer confidence, market action has deteriorated in interest-sensitive sectors, and internal dispersion has been widening more broadly. As of Friday, more than one-third of stocks are already below their 200-day moving averages. Indeed, even with the major indices near record highs, more NYSE-traded issues set new 52-week lows last week than new highs, while credit spreads abruptly widened. All of these considerations have been remarkably useful in helping to identify points of risk and opportunity in prior market cycles, and despite the stumble that followed my stress-testing decision in 2009, I’m convinced that these considerations are relevant here. Those of you who have followed my work over the years will recall that a material market retreat, bearish sentiment, dismal consumer confidence and positive divergences after the 1990 market low were among the combined factors that encouraged me to advocate a fully leveraged investment stance. Similar considerations prompted our constructive shift in early 2003, after the 2000-2002 bear market collapse. Though confidence remained weak for months after that market low, I emphasized “suffice it to repeat that consumer sentiment is actually a lagging indicator that can be predicted from past movements in indicators such as capacity utilization, inflation, and unemployment.” Put simply, elevated levels of consumer confidence are less a signal of forthcoming consumer spending as they are a signal of forthcoming investor losses.
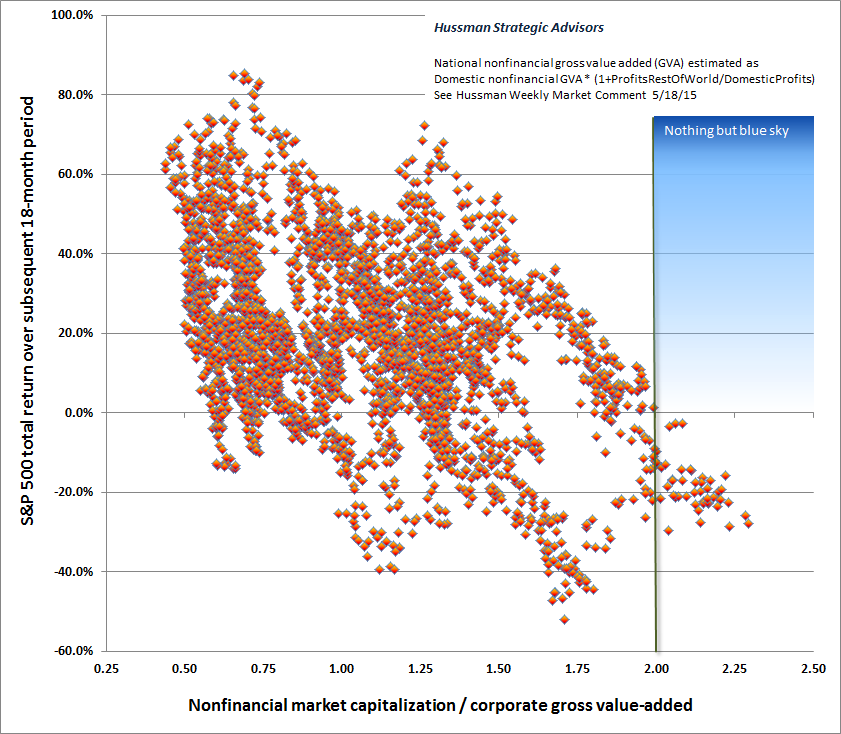
Conversely, in the context of extreme valuations, sentiment, overextended market action, and deteriorating uniformity (particularly across interest-sensitive securities), investors should take the recent high in consumer confidence as a warning of euphoric sentiment. In August 2007 (see Strong Economic Optimism), I offered a similar warning shortly before the global financial crisis began: “Despite credit concerns, Wall Street remains exuberant about economic prospects. Last week brought a 6-year high in consumer confidence, evidently supporting the idea that the consumer remains strong and the economic expansion remains intact. Unfortunately, if you examine the data, you'll quickly discover that consumer confidence is a lagging indicator, well explained by past movements in GDP, employment, and capacity utilization. Worse, for the stock market, it's a contrary indicator (especially when it is well above the ‘future expectations’ component of the same survey). This is a fact that I've noted at both extremes, not only in early 2000 when new highs in consumer confidence supported a defensive position, but conversely in the early 1990's, when new lows in consumer confidence supported a leveraged position in stocks (prompting that “lonely raging bull” comment in the L.A. Times). “High levels of economic optimism are regularly observed at the peaks of both U.S. and foreign economic expansions. This includes the general consensus of individuals, businesses, politicians, central bank officials and notoriously - economists. That shouldn't be surprising. It's the very nature of a peak that it can't be produced except by unusual optimism. Here's a phrase you don't hear a lot - ‘global recession.’ It's interesting how immediately and reflexively Wall Street rules it out. A great deal of the world's present stock market capitalization relies on ruling it out for years and years to come.” Blue Skies During the later part of the roaring 20’s, Irving Berlin wrote “Blue Skies,” which captured some of the optimism of the era that preceded the Great Depression. Unfortunately, untethered optimism is not the friend of investors, particularly when they have already committed their assets to that optimism, and have driven valuations to speculative extremes. There are two primary arguments we hear from investors inclined to shrug off concerns about risk here. One is that “stocks are fairly valued relative to interest rates.” My hope is that the extensive discussion and evidence in last week’s comment was useful in disabusing that argument, which we also observed at the 2007 market peak. The second argument is “yes, but stocks were overvalued years ago, and they’re higher now, so valuations don’t really matter.” On this point, be very careful. As I’ve regularly noted, what separates an overvalued market that continues to advance from an overvalued market that can drop like a rock, is the attitude of investors toward risk. The best measure of that is the uniformity or divergence of market internals across a broad range of individual stocks, sectors, industries, and security types (including debt securities of varying creditworthiness). Yes, we observe extreme investor optimism at present, but we simultaneously observe internal cracks in that foundation that have historically been permissive of rapid collapse. Recognize that the only thing “different” in the recent advancing half-cycle was that zero-interest rate policy encouraged continued speculation even after extreme overvalued, overbought, overbullish syndromes emerged. One had to wait for market internals to deteriorate explicitly. My impression is that the S&P 500 is likely to surrender its entire gain since 2014 merely as the opening loss of the coming cyclical decline. Given the negative signal that we presently infer from market internals, I doubt that investors have a great deal of time to adjust their investment stance before substantial market losses emerge. Indeed, I doubt that any market gains investors hope to achieve here will be retained 18 months from now, or even 10 years from now. To illustrate the likely time-frame over which we expect valuations to impact the actual market return/risk profile, the scatterplots below present the ratio of nonfinancial market capitalization to corporate gross value-added, including estimated foreign revenues. In each chart, the green bar shows the current level of valuations. The plots present S&P 500 returns over a number of subsequent horizons. The first chart below shows MarketCap/GVA on the horizontal axis, along with actual subsequent S&P 500 total returns over the following 18-month period. Note that there is not a single dot, in historical data since 1947, where the subsequent 18-month market return was above zero, given starting valuations at current levels or higher. Look to the right of current valuations and above zero returns: nothing but blue sky.
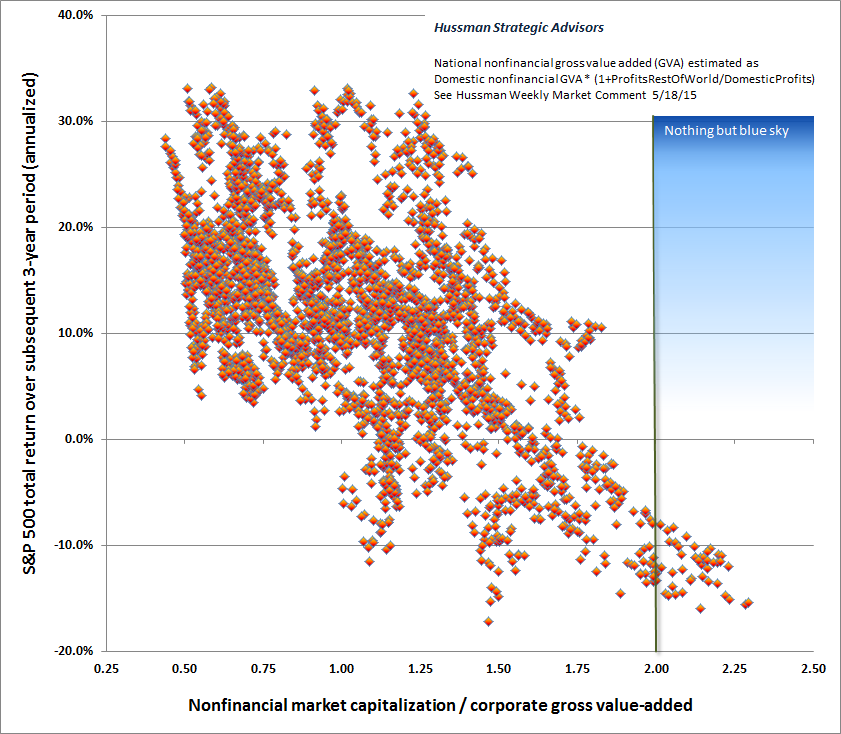
The next chart shows the same scatter with 3-year S&P 500 annual total returns. You’ll notice that the range of the scatter has become narrower, as the impact of valuations on longer-term returns becomes more predictable. Again, look to the right of current valuations and above the zero line. Nothin' but blue skies do I see.
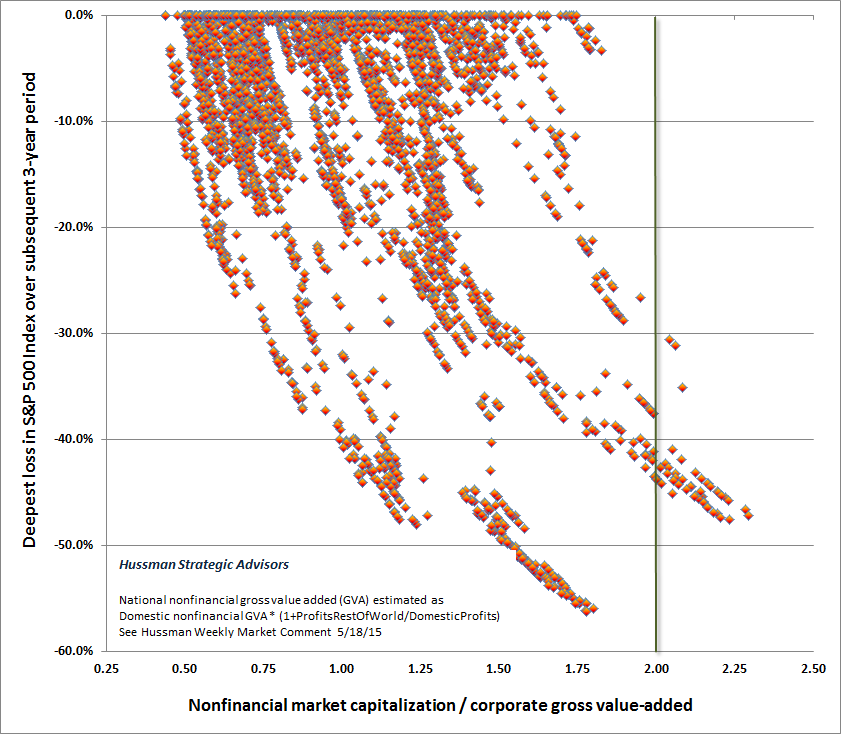
As a side note, observe that from valuations similar to the present, the average market loss by the end of the subsequent 3-year period ranged between -8% to -15% (annualized). But the deepest interim market loss within that period was more severe. The chart below shows the deepest interim loss in the S&P 500 Index over the following 3-year period, plotted against MarketCap/GVA. With market valuations approaching the 2000 extreme, it’s worth remembering that valuations are already well beyond the 2007 peak, which was followed by an interim market loss in excess of -55%.
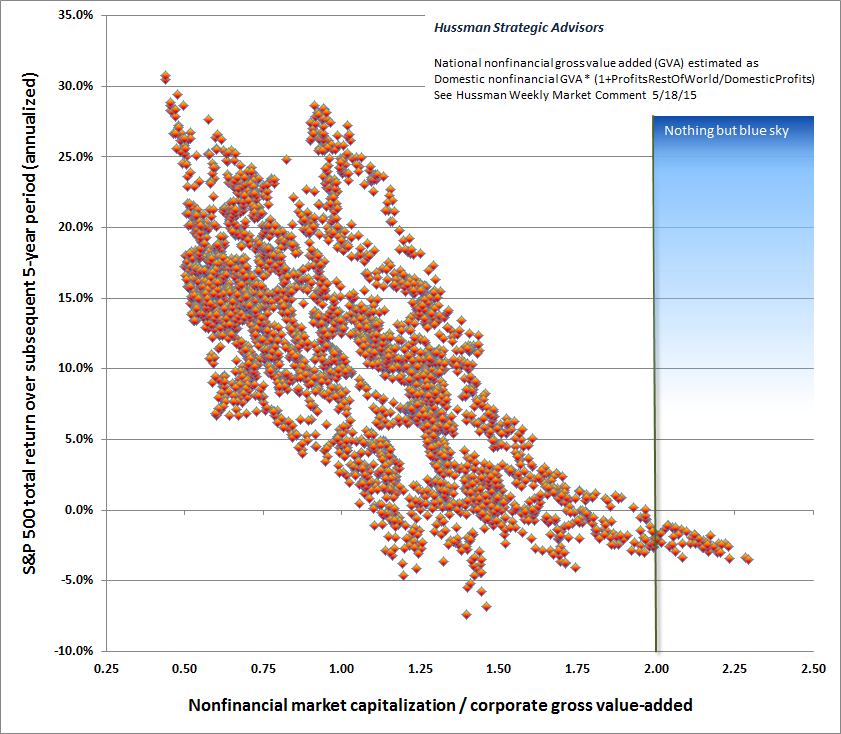
The chart below shows valuations against subsequent 5-year S&P 500 annual total returns. Investors should not be surprised to find a passive investment in the S&P 500 still showing material losses 5 years from today.
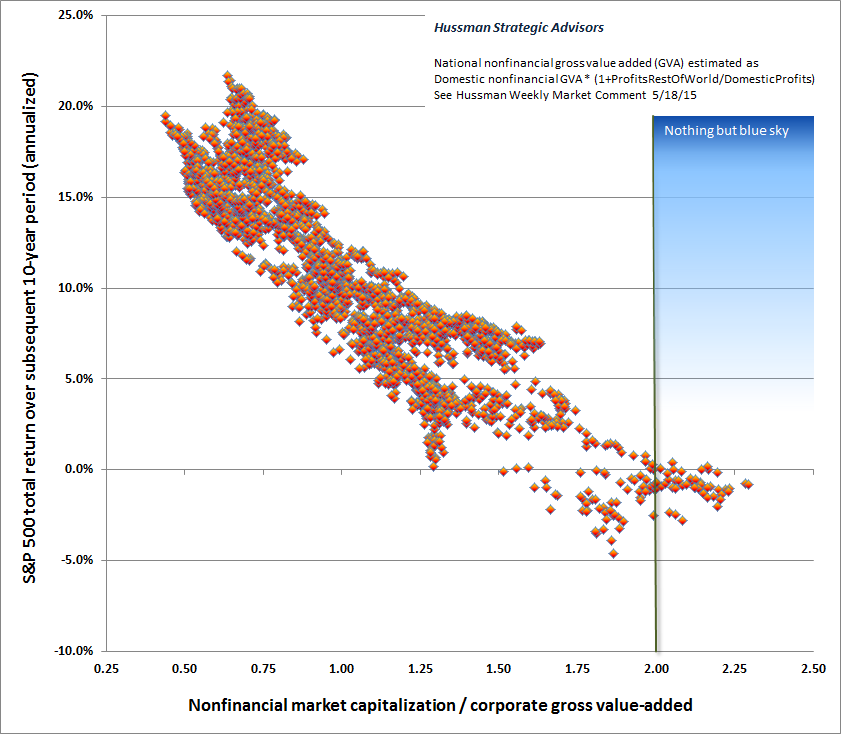
Finally, the chart below extends the horizon to a full decade. Notice again that the scatter of points relating starting valuations to subsequent market returns is even tighter and more predictable. As I’ve often noted, this is a very robust feature of valuations: near-term market outcomes, even over a period of a few years, are not terribly reliable based on valuations alone, since investor risk-preferences factor so heavily into market behavior over shorter segments of the market cycle. But the mapping between valuations and expected subsequent market returns becomes particularly reliable on investment horizons of 10-12 years (the point where the autocorrelation of reliable valuation measures typically hits zero - see Valuations Not Only Mean-Revert, They Mean-Invert).
Investors rarely recognize euphoria when they are in the midst of it. I remain fully convinced that now is one of those times. It’s not clear what the market will do over the very near-term, but history casts doubt on the notion that any further market returns will actually be retained by investors over the completion of this cycle. What actually tends to happen at market peaks is this. First, investors become convinced that trend-following measures will get them out when the time comes. Next, the market takes an abrupt initial dive that’s deep enough to send those measures to a sell signal. But that dive is also typically steep enough to provoke “oversold” readings on a variety of measures, so trend-followers ignore the signal in anticipation of the bounce. The bounce then arrives, and they congratulate themselves for their acuity. That’s the hook, because on the next selloff, trend-followers expect the same pattern to hold, and once it repeatedly fails, about the point that the market is already down about 15%, the crowd makes a concerted effort to exit and stop their losses, at valuations nowhere near the point where value-conscious investors would be inclined to absorb that supply. The result is a free-fall. The same sequence describes the aftermath of other overvalued extremes across history. In April 2000, I described the psychology that investors could expect to play out over the completion of the market cycle: "This is my retirement money. I can't afford to be out of the market anymore!" My view today is the same I expressed in December 1999: “One thing is certain. This market cycle will be completed by a bear market, and a potentially violent one. Of course, nobody thinks about market cycles anymore. Nobody imagines that stocks can do anything but advance. And in the mania of the present, it is easy to forget the nearly identical ones of the past, and their very, very bitter aftermaths.” A final note. Every investment approach has its season, and my impression is that passive investment strategies are approaching the start of a very long, hard winter. We fully expect patient, diligent passive investment in the S&P 500 to be rewarded with nothing over the coming decade (though new investments made in the interim, at less extreme valuations, are likely to fare better). I have no objection to passive investment strategies, provided that those strategies are appropriate to the actual risk-tolerance, temperament, and investment horizon of each investor. Every share of stock that has been issued must be held by someone at every point in time until it is retired, and the most appropriate holders in the next few years will be those who have the risk-tolerance, temperament, and investment horizon to do so. I strongly believe that there is a mapping between reliable valuation measures and the subsequent market return/risk profile that investors can expect. Yet even for investors who don’t believe that prospective market return/risk profiles can be estimated, it is still important to allow for near-zero 10-12 year S&P 500 total returns and a likely interim loss on the order of 50-60%. Regardless of whether saving takes the form of regular passive investments, or accumulating dry powder for a while, investors should not let market valuations disrupt their disciplined saving. The key issues are how much of those future savings are still ahead, how tolerant investors are of interim losses, how closely they want their investments to track the market, and how soon they will need the funds. To the extent that investors would not be capable of adhering to a passive discipline if our return/risk expectations prove accurate over the completion of this cycle (as they did after the 2000 and 2007 extremes), they are taking market exposures that are inconsistent with sustainable discipline, as well as a century of market history. For that reason, I encourage passive investors to align their exposures to the point where they would, in fact, have the capacity to maintain their discipline over time, should these expectations be realized.The foregoing comments represent the general investment analysis and economic views of the Advisor, and are provided solely for the purpose of information, instruction and discourse. Please see periodic remarks on the Fund Notes and Commentary page for discussion relating specifically to the Hussman Funds and the investment positions of the Funds. --- The foregoing comments represent the general investment analysis and economic views of the Advisor, and are provided solely for the purpose of information, instruction and discourse. Prospectuses for the Hussman Strategic Growth Fund, the Hussman Strategic Total Return Fund, the Hussman Strategic International Fund, and the Hussman Strategic Dividend Value Fund, as well as Fund reports and other information, are available by clicking "The Funds" menu button from any page of this website. |
|||||||||||||||||||||||||
|
For more information about investing in the Hussman Funds, please call us at
1-800-HUSSMAN (1-800-487-7626) 513-326-3551 outside the United States Site and site contents © copyright Hussman Funds. Brief quotations including attribution and a direct link to this site (www.hussmanfunds.com) are authorized. All other rights reserved and actively enforced. Extensive or unattributed reproduction of text or research findings are violations of copyright law. Site design by 1WebsiteDesigners. |